
EV Charging Cost: Home and Public Charger Calculations
2026-11-03 · Updated: 2026-11-04 · 4 min read
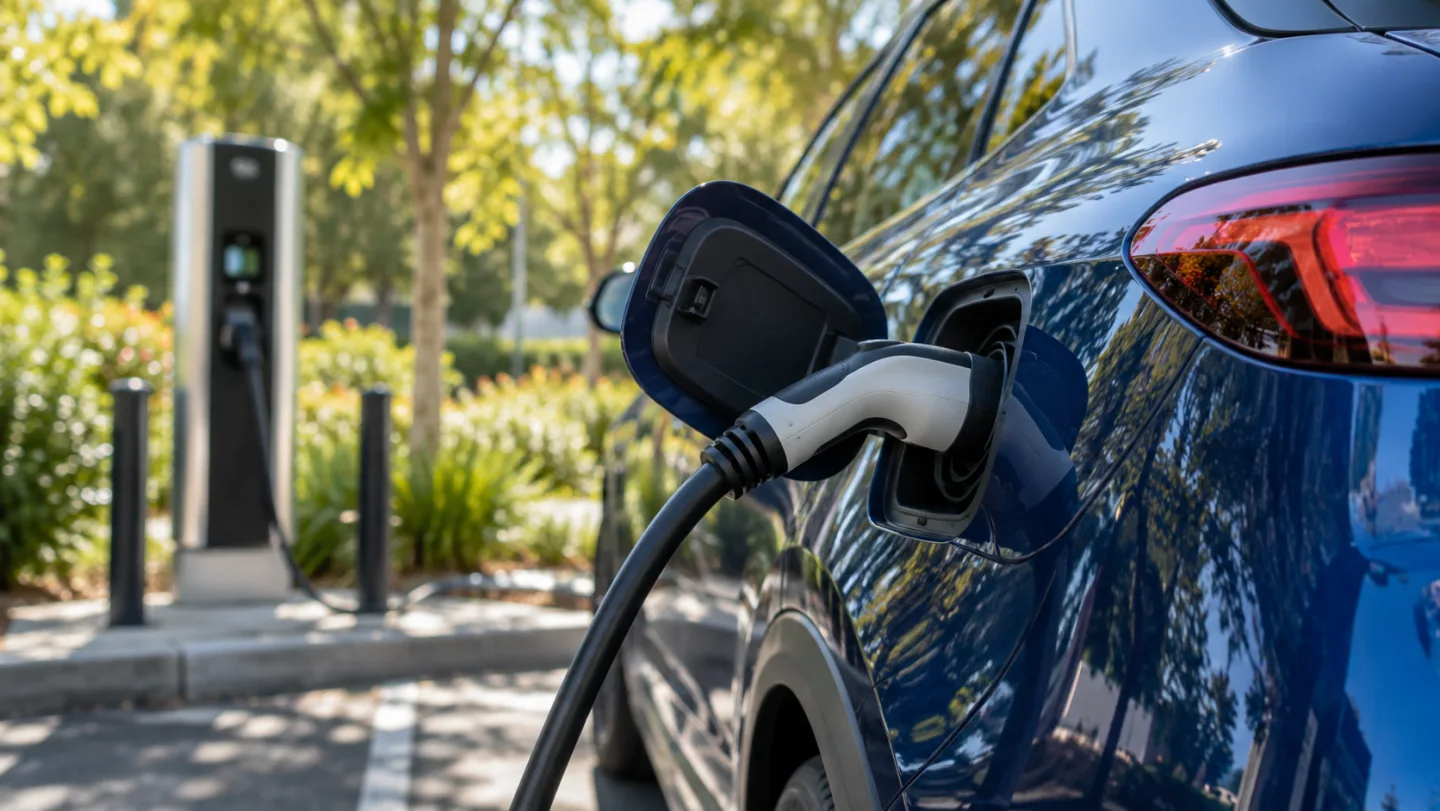
To estimate the cost of a charging session, first distinguish energy stored in the battery from energy purchased at the charger. Battery percentage, charging power and the final bill describe different parts of the process. Keeping those quantities separate makes home and public charging comparisons easier to interpret.
Convert battery percentage into energy
Suppose the assumed usable battery capacity is 60 kWh and charging goes from 20% to 80%. The change is 60 percentage points, or 0.60 of the usable capacity. Estimated energy added to the battery is 60 × 0.60 = 36 kWh.
This is a simplified planning estimate. The vehicle's displayed percentages and usable capacity do not create a precision energy meter. Use the correct model's documentation, and compare actual session records when available. Do not substitute a gross battery capacity without checking what the figure represents.
Account for the measurement boundary
At a hypothetical 90% charging efficiency, delivering 36 kWh to the battery requires 36 ÷ 0.90 = 40 kWh from the source. The difference belongs to the charging process under that assumption. It is not a fixed loss percentage for every vehicle, charger or weather condition.
If your charger already bills 40 kWh, calculate the bill from that measured amount. Do not divide it by efficiency again. Conversely, multiplying a battery-only estimate directly by the tariff can understate spending if the purchased energy is higher.
Apply prices to the same energy quantity
For illustration, 40 kWh purchased at TRY 4 per kWh costs TRY 160. At TRY 10 per kWh, it costs TRY 400. The difference is TRY 240 for the same assumed purchased quantity. These prices are examples, not current Turkish tariffs or a provider quote.
Check whether a real public session also includes time, connection, idle or parking charges. Record them separately so another reader can reproduce the comparison. A displayed price per kWh is not enough to reconstruct a bill with additional charges.
Plan mixed charging correctly
If some energy is bought at home and some at public chargers, weight prices by purchased kWh. The video uses 120 kWh at TRY 4 and 80 kWh at TRY 10: total spending is TRY 1,280 for 200 kWh, or TRY 6.40 per kWh. The number of charging sessions is not the appropriate weight unless every session purchases equal energy.
For a monthly budget, multiply the expected purchased energy by the weighted price and add other applicable charges. Keep a higher-public-charging scenario as well if travel can change your routine. This shows how sensitive the estimate is to where you charge.
Charging speed and charging cost are different
A charger's kW rating describes power, while kWh describes energy. A higher rated power does not mean the car accepts that power continuously. Battery state, temperature, the vehicle and site conditions can change the session profile. Read the DC charging power guide before treating a headline rating as a promised session average.
For a time estimate, constant power would imply time equals energy divided by power. Real sessions can vary, so do not present that simplified calculation as a measured charging duration.
Keep a useful charging record
Write down starting and ending percentage, the energy shown by the billing meter, price basis, extra charges and the final amount paid. Compare the same vehicle and similar conditions before attributing a difference to the charger. The aim is a traceable estimate, not a guaranteed result from one assumed efficiency.
To compare with petrol or diesel, use the cost per 100 km method and keep battery-side or purchased-energy measurements consistent. Vehicle ownership costs remain a separate calculation.
Sources and scope
Related videos
The linked videos use Turkish narration. This article provides the English explanation of the same topic and assumptions.
Edited by GKN Labs. Editorial update: 4 November 2026. Cover and explanatory visuals are illustrative, not evidence of product testing or measurement.
Related
 Business
How Long to Upload 1 TB? Use Upload Speed, Not Download
Calculate 1 TB cloud upload time from Mbps, distinguish bits from bytes and account for daily operating hours, interruptions and real service limits.
 Business
NAS Electricity Cost: Calculate 24/7 Energy Use
Calculate annual NAS electricity use from watts or measured kWh, understand adapter ratings and add energy to a complete storage-cost comparison.

NAS vs Cloud Storage: Compare Three-Year Ownership Costs
Compare NAS and cloud storage with a three-year cost example, usable RAID capacity, electricity, backup requirements and a practical decision checklist.
Turkish narration. Estimate EV charging cost from battery percentage, usable capacity, charging efficiency and a consistent home or public electricity price. Read the companion English guide for the same topic and assumptions.
Turkish narration. Estimate EV charging cost from battery percentage, usable capacity, charging efficiency and a consistent home or public electricity price. Read the companion English guide for the same topic and assumptions.